Make Everyday Home Routines Easier with eWeLink
Control, automate, and share your home more easily with eWeLink.

Here’s a question most people cannot answer right away:
How much does it actually cost to run the devices in your home?
That old fan running in the background? The phone charger plugged in all day? The AC you forgot to turn off when you left? Each one adds up — quietly, invisibly, month after month.
With eWeLink, you can see exactly what’s consuming electricity, set schedules to turn devices off automatically, and track your savings over time. No complicated setup required.
Some devices consume power even when they’re “off” — standby power, phantom load, energy vampires. The biggest culprits:
A smart plug with power monitoring tells you exactly how much each device uses — in real time and over time.
Power monitoring smart plugs don’t just turn devices on and off — they measure how much power each device consumes.
Open the eWeLink App > Tap “+” > Add your power monitoring plug > Plug in the device you want to monitor.
Once set up, you’ll see real-time power consumption data in the app. Over a few days, you’ll have a clear picture of which devices are costing you the most.
Where to start:
Device to Monitor | Why It Matters |
Air conditioner | Often one of the biggest energy consumers |
Water heater | Runs frequently, often unnoticed |
Refrigerator | Runs 24/7 — old ones waste a lot |
Desktop computer | High standby power |
Space heater | High power consumption in a short time |
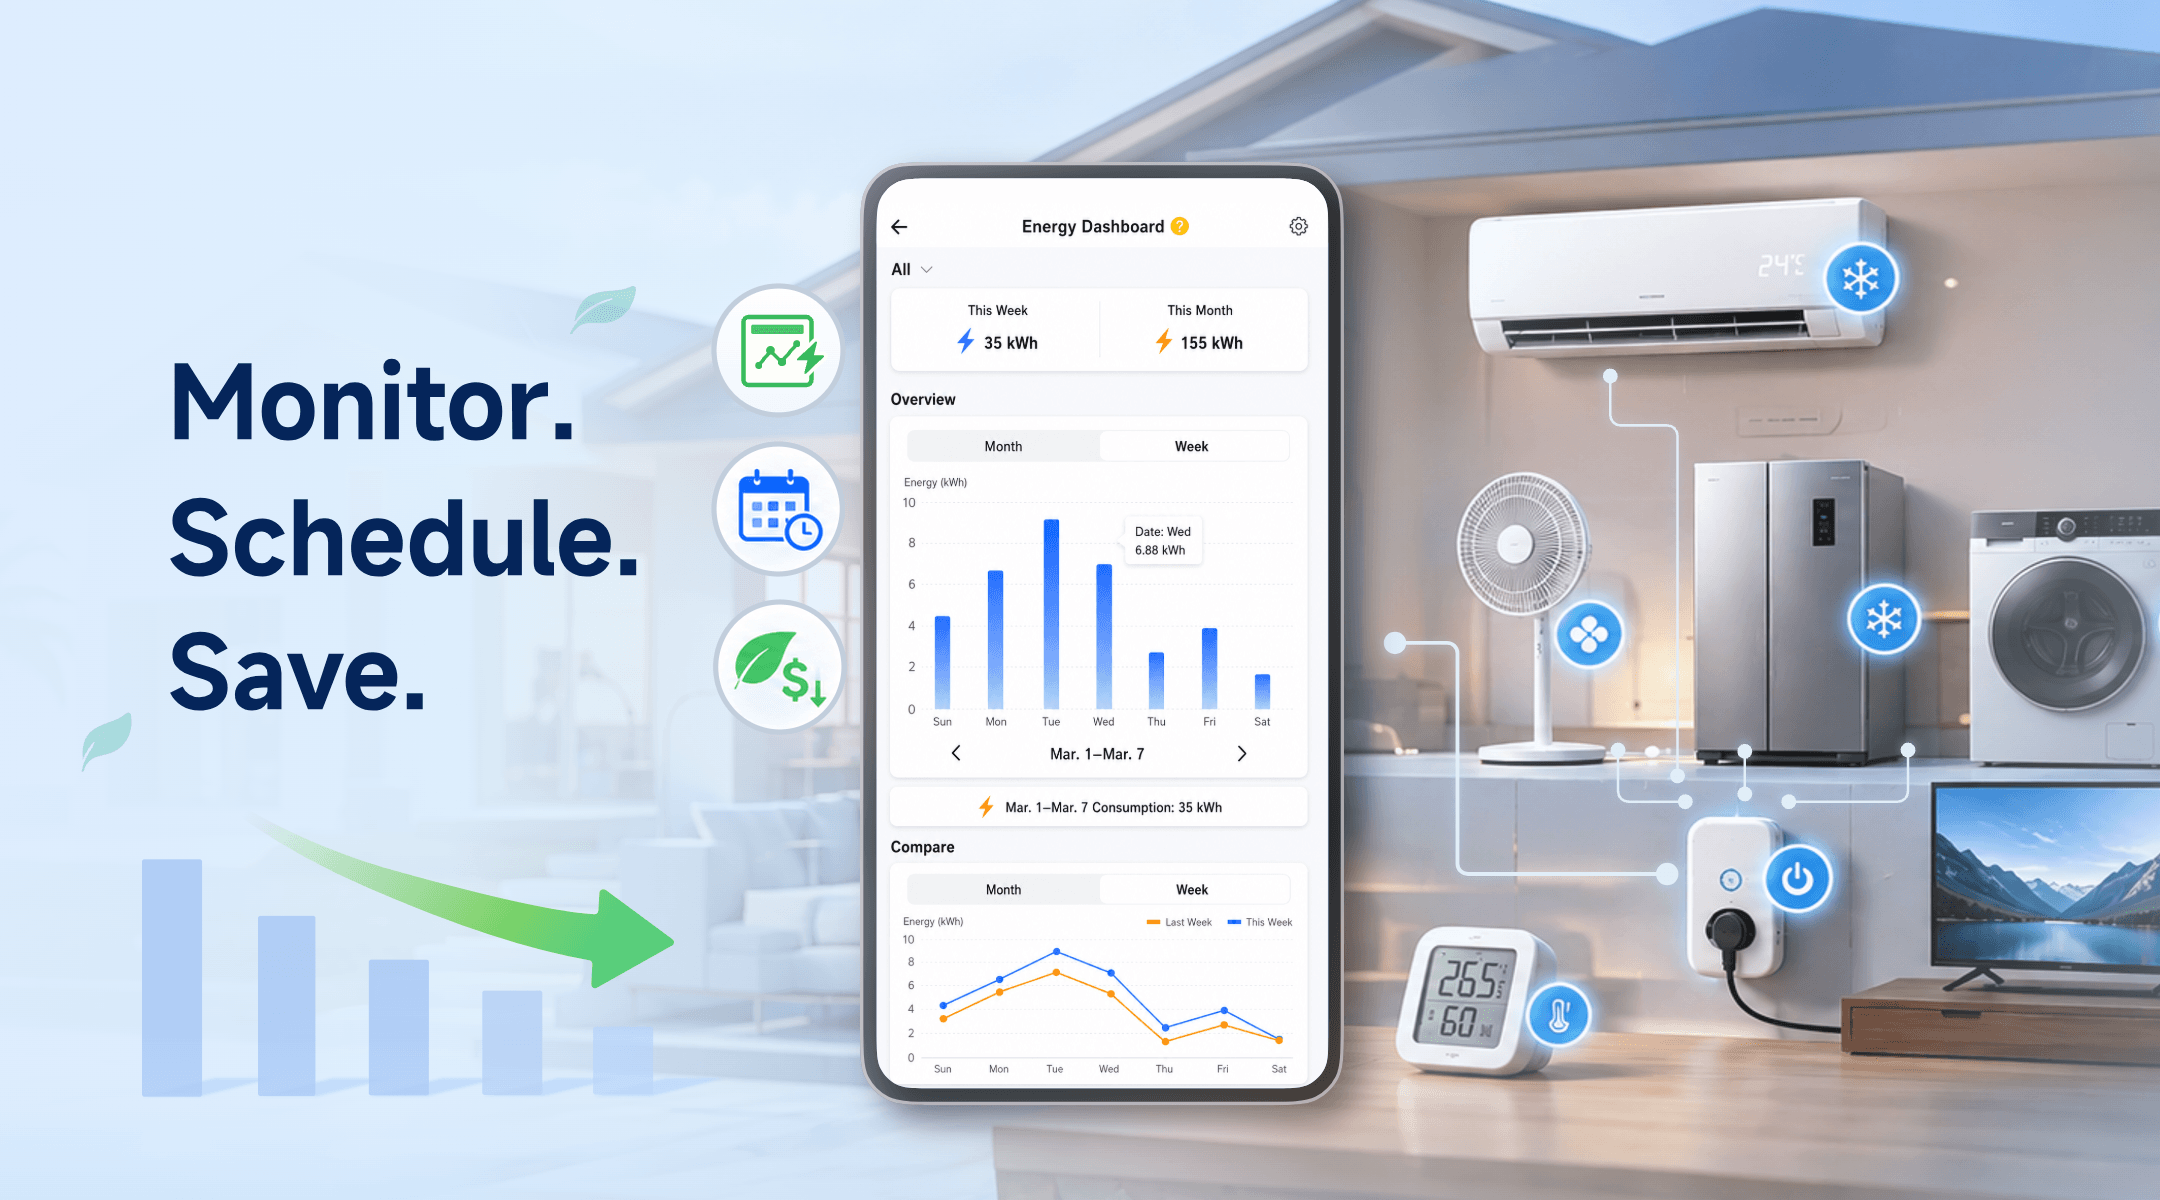
eWeLink’s built-in Energy Dashboard gives you a visual breakdown of your electricity usage.
Open the eWeLink App > Go to “Insight” > Tap “Energy Dashboard”.
Here you can:
This makes it easier to spot high-consumption devices, understand which rooms use the most electricity, and adjust your schedules or automations based on real usage data.
Once you know where energy is being wasted, use schedules and scenes to reduce unnecessary runtime automatically.
For a single device, use Schedule.
For multiple devices, use a Scene.
Schedule 1: Auto-off for high-draw devices
Turn off the space heater at 11 PM. Turn off the water heater during work hours (9 AM – 5 PM).
Open the eWeLink App > Select the device > Tap “Schedule” > Set the time and action.
Scene 2: Night mode
At 11 PM, turn off all non-essential devices: living room lights, TV plug, computer monitor.
Create a Manual Scene called “Night Mode” with all these devices as actions. Run it with one tap.
Scene 3: Away hours
When you leave for work, turn off AC, fans, and lights. Turn them back on 30 minutes before you return.
Use Auto Scenes to handle this — for example, turn off the AC, fans, and lights at 9:00 AM on weekdays, then turn on selected devices when the door sensor is triggered in the evening.
If you have a temperature sensor, you can create scenes that respond to real conditions — not just schedules.
Example: Smart Cooling Control
● Condition: Room temperature rises above 28°C
● Action: Turn on a connected fan or cooling device
● Condition: Room temperature drops below 24°C
● Action: Turn it off
This way, your cooling device only runs when it’s actually needed — no more leaving it on all day.
After a month of using power monitoring plugs and smart schedules, check your Energy Dashboard again. Compare your usage to the previous month.
Most users see a noticeable difference — especially when they:
Even small changes add up. Turning off standby devices may only save a little at a time, but multiply that across your whole home, and the savings become easier to see.
What important features are we missing? We’d love to hear from you! Join our discussion here.
Control, automate, and share your home more easily with eWeLink.
Use eWeLink to monitor, automate, and reduce wasted electricity at home.
A quick beginner’s guide to getting started with eWeLink.
Bring order to your smart home with effortless scene organization.