How to Build a Smarter Backyard Chicken Coop with eWeLink
Keep a closer eye on your backyard coop with eWeLink through smart monitoring, alerts, and remote viewing.

You can’t optimize what you can’t see. The eWeLink Energy Dashboard helps you understand how your devices use electricity and make smarter decisions for your home.
Electricity usage can change over time. Some devices run longer than expected, while others continue consuming electricity even when they appear inactive.
With the eWeLink Energy Dashboard, you can view electricity consumption data, compare usage trends, and identify which devices use more electricity—all from the eWeLink app.
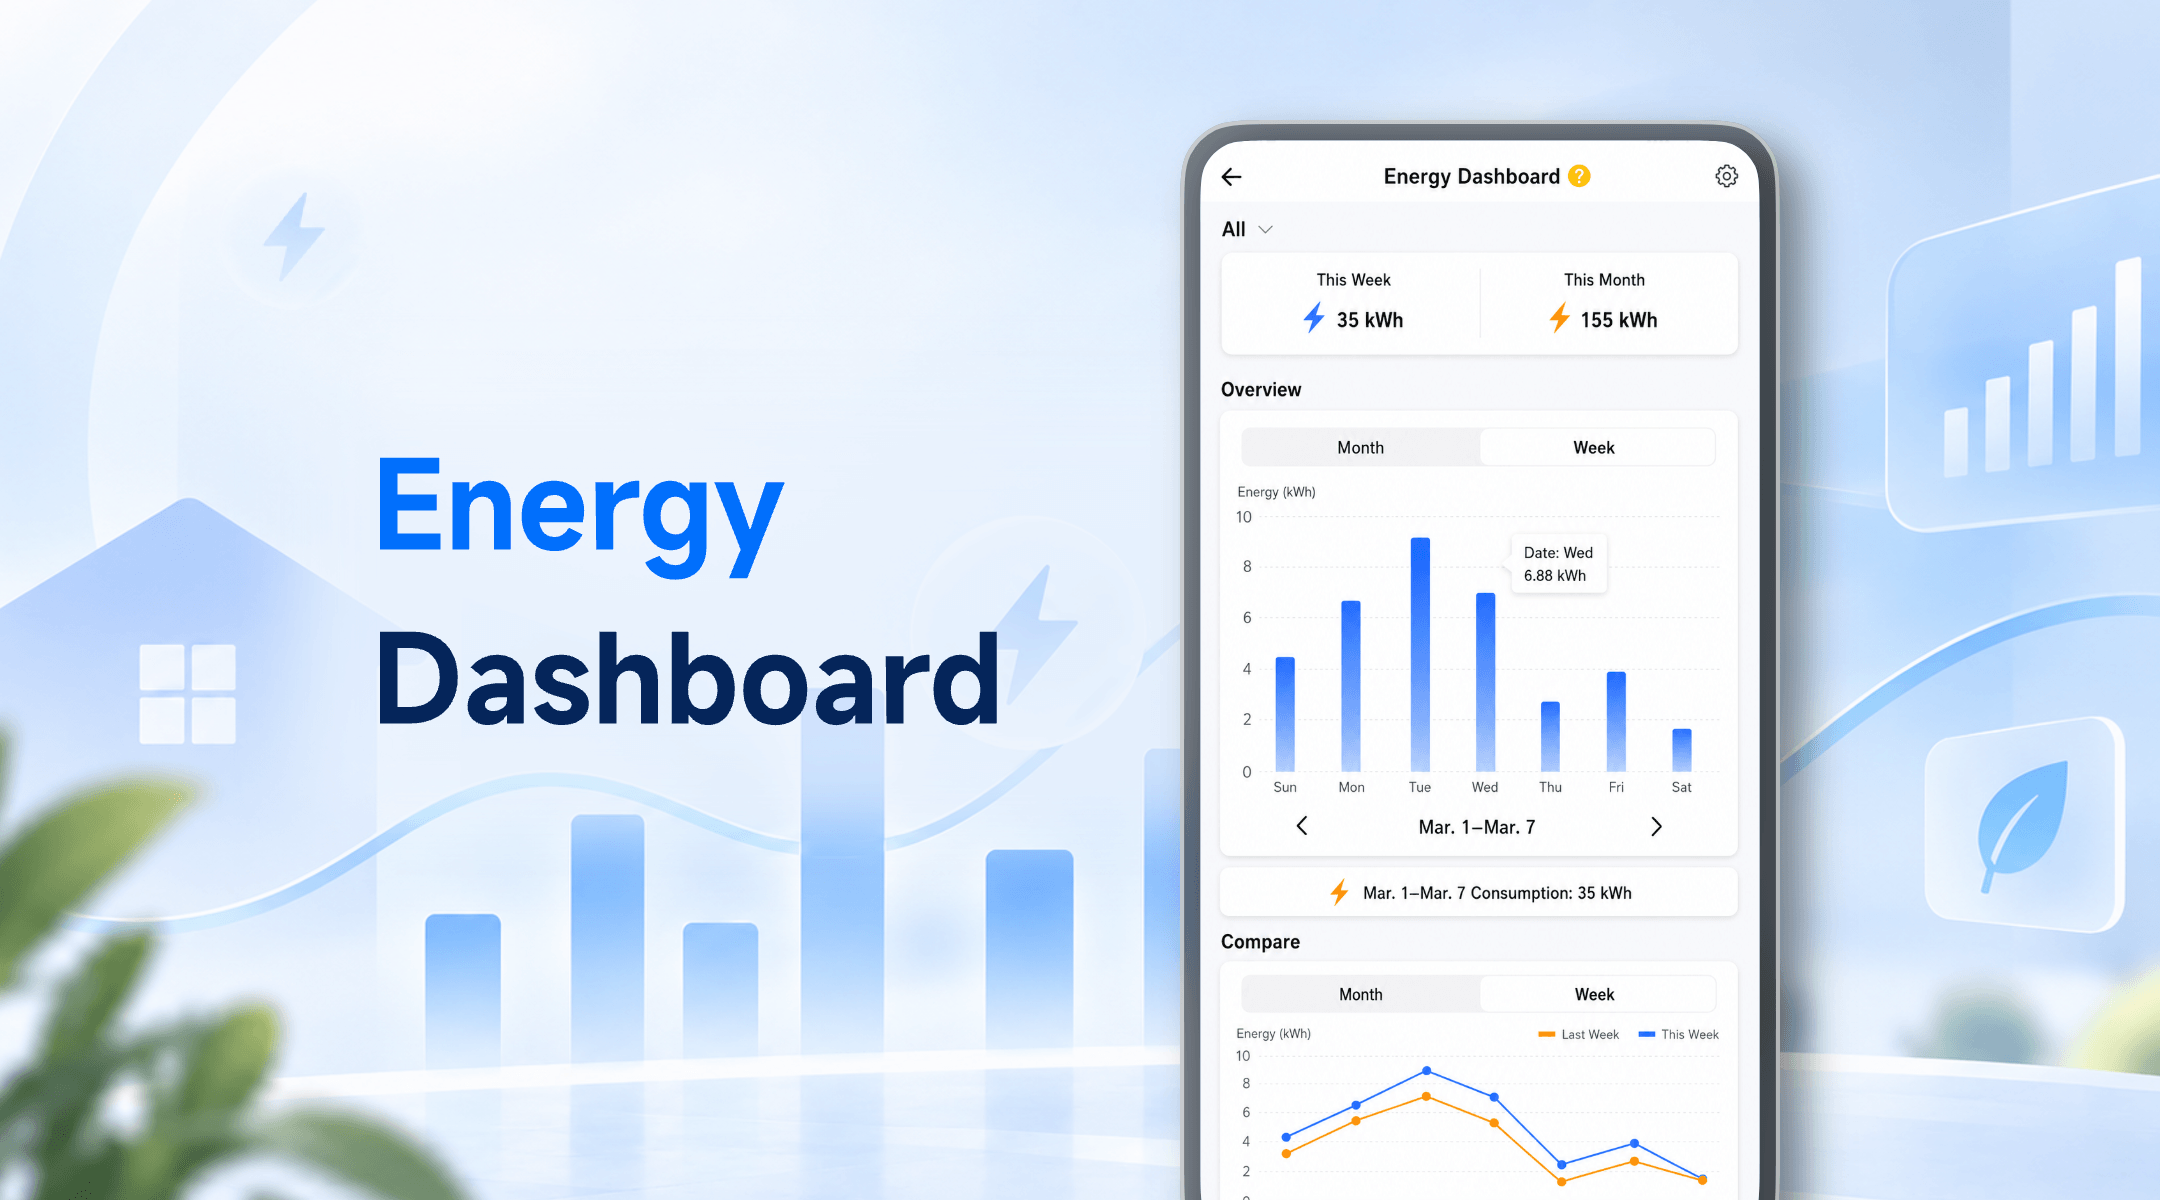
The Energy Dashboard is a built-in feature in the eWeLink app that helps you view and analyze electricity consumption from compatible power monitoring devices.
By connecting devices such as power-monitoring smart plugs, you can track electricity usage and better understand how different appliances contribute to your home’s electricity consumption.
The Energy Dashboard helps you answer questions like
Your electricity consumption overview will be displayed in the dashboard.
The Energy Dashboard helps you review your electricity usage over different time periods.
Weekly and monthly views make it easier to understand changes in your electricity consumption patterns.
For example:
Understanding your electricity usage patterns is the first step toward smarter home management.
The dashboard helps you see which connected devices consume more electricity.
This can help you discover:
For example, you may find that a home office setup, aquarium equipment, or heating devices consume more electricity than expected because they operate for many hours each day.
Group your power monitoring devices based on your daily routines or home areas.
Examples:
This makes it easier to understand electricity usage in different parts of your home.
The Energy Dashboard helps you understand your electricity usage. eWeLink automation features help you take action.
A simple workflow:
Check the Energy Dashboard to identify devices with higher electricity consumption.
Create schedules or scenes for devices that do not need to run all the time.
Examples:
Check your electricity consumption data again to see how your usage patterns change.
By combining electricity monitoring with automation, you can make your smart home more efficient.
|
Item |
Purpose |
|
eWeLink App |
View and manage electricity consumption data. |
|
Compatible power monitoring device |
Measure electricity consumption. |
With the eWeLink Energy Dashboard, understanding your home’s electricity usage becomes easier—helping you make smarter decisions and build a more efficient smart home.
What important features are we missing? We’d love to hear from you! Join our discussion here.
Keep a closer eye on your backyard coop with eWeLink through smart monitoring, alerts, and remote viewing.
Simplify aquarium care with eWeLink through smart schedules, monitoring, alerts, and remote viewing.
Monitor electricity usage, compare trends, and identify high-consumption devices with the eWeLink Energy Dashboard.
Find out why your scenes don’t run and how to fix common automation issues.