Make Everyday Home Routines Easier with eWeLink
Control, automate, and share your home more easily with eWeLink.


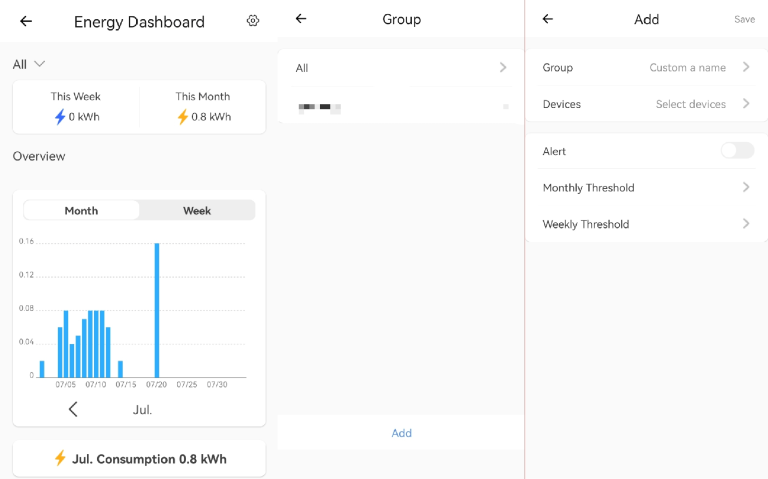
 icon in the upper right corner, and tap “Add” to create a new group for your supported devices.